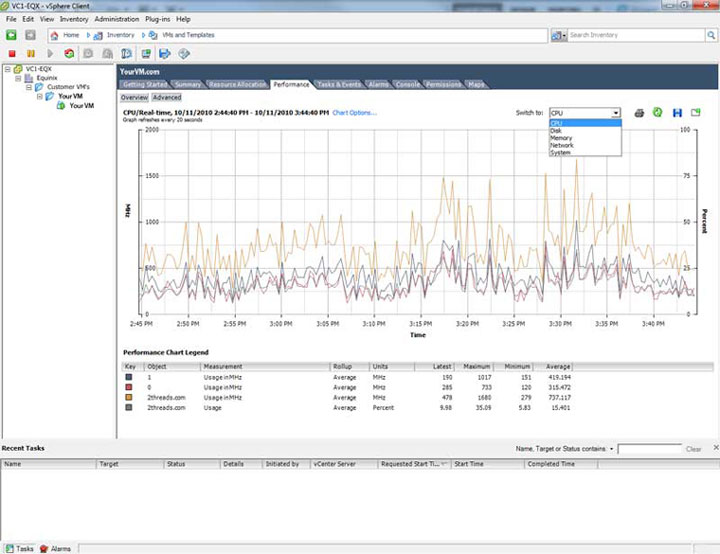
Monitor VMware Resources in vSphere
Once logged into vSphere, click on the “Performance” tab to monitor your virtual servers resources in real-time. There are configurable statistics for CPU, Disk I/O, RAM & Network resources to continuously monitor your server. If your server is utilizing high resources you will be able to instantly track this down, or potentially increase these resources by ordering addons for your server.
Monitoring VMware resources is crucial for ensuring the smooth performance of your virtual environment and proactively addressing potential issues. VMware vSphere provides built-in tools to monitor various metrics and resources. Here’s a guide on how to monitor VMware resources in vSphere:
1. Access vSphere Client:
- Log into your vSphere Client. This could be the vSphere Web Client or the newer vSphere Client (HTML5 based).
2. Navigate to the Hosts and Clusters View:
- From the Home screen, click on “Hosts and Clusters”. Here, you’ll see your datacenters, clusters, and individual ESXi hosts.
3. Select the Target:
- Choose the datacenter, cluster, ESXi host, or virtual machine (VM) you wish to monitor.
4. Monitor ESXi Host:
- After selecting a specific host, click on the “Monitor” tab.
- Performance: Check CPU, memory, network, and storage usage. You can change the view between real-time, day, week, month, or year.
- Events: Lists significant operations/events on that host.
- Logs: Access the ESXi logs directly from here.
- Hardware Status: View the health and status of various hardware components.
5. Monitor Virtual Machines (VMs):
- Select a VM and click on the “Monitor” tab.
- Performance: Monitor the VM’s CPU, memory, network, and disk metrics.
- Events: See all events associated with the VM.
- Tasks: Check ongoing or completed tasks related to the VM.
6. Utilize Alarms:
- vSphere provides predefined alarms to notify admins of specific events or issues.
- To view alarms:
- Select a target (Datacenter, ESXi host, or VM).
- Click on the “Monitor” tab and then “Issues”. Here, you can view triggered alarms and acknowledge or reset them.
- To define or edit alarms, navigate to “Manage” > “Alarm Definitions”.
7. Use Performance Charts:
- Drill down into more detailed performance charts to identify bottlenecks or anomalies.
- Customize the chart by selecting counters, setting time ranges, and choosing the type of graph.
8. Check Storage Reports:
- Navigate to “Datastores” and select a specific datastore.
- Check capacity, space utilization, and any issues related to the datastore.
9. Monitor Network Performance:
- Navigate to “Networking” and select a specific network.
- Monitor transmit, receive rates, and other key network metrics.
10. vSphere Health Check:
- From vSphere Client, navigate to “Menu” > “Cluster”.
- Under the “Monitor” tab, select “vSphere Health”.
- This tool can assess your environment’s health and recommend solutions for identified issues.
Additional Tools and Considerations:
- Consider using third-party monitoring tools for more detailed insights, alerts, and automation.
- Set up appropriate roles and permissions for monitoring, ensuring that only authorized personnel can access performance data.
- Regularly check VMware’s official documentation and community forums for best practices and updates on resource monitoring.
Conclusion: Regularly monitoring VMware resources in vSphere ensures optimal performance and resource allocation. Utilize built-in tools, set up alarms for proactive issue identification, and consider integrating third-party solutions for a comprehensive monitoring strategy.
Business Continuity and Disaster Recovery
All of our Enterprise VMware Cloud Servers can be protected with Veeam Backup & Disaster Recovery , which is an Award Winning Backup Replication and Disaster Recovery solution
Deploy Your New Mission Critical Cloud Server Today
FASTDOT’s Enterprise Cloud Server are excellent choices for:
- IaaS Cloud Stack for reselling virtualised environments
- Mission critical financial institutions running MetaTrader / Forex Trading Solutions
- Implementing mission-critical SAP, Exchange, Sharepoint, Zimbra or MS SQL Database Server
- Security with high-grade ISO 27001 qualifications.
- Businesses looking to upgrade to a dedicated server, but not looking to spend thousands of dollars on hardware and datacenter hosting costs.
- Setting up your own external Exchange or MSSQL database server powered by the resources of a Tier 3 data centre.
- Small or large dynamic websites needing to move away from restrictive shared hosting environments.
- Web hosting resellers looking to take their business to the next level.
- A cost-effective method for delivering dynamically scalable “Infrastructure as a Service” (IaaS Hosting) and “Software as a Service Hosting” (SaaS Hosting) solutions which can scale up or down with your evolving business needs.
- Customers who require Mission-Critical hosting environments with dynamic scalability where 24/7 uptime is absolutely critical to your business needs
Get Started with VMware Cloud Hosting
Your new VMware Virtual Servers will be commissioned shortly.
Deploy your new Virtual Machine Today